HPA默認支持基于CPU和內存指標實現自動伸縮,可能無法滿足更為復雜的運維場景。如果您需要將Prometheus收集的Custom Metrics與External Metrics轉換為HPA可用的彈性伸縮指標,您可以參見本文獲取監控數據并實現對應的伸縮配置,為應用提供更靈活、便捷的擴縮機制。
前提條件
已部署阿里云Prometheus監控組件。具體操作,請參見使用阿里云Prometheus監控。
已部署ack-alibaba-cloud-metrics-adapter組件。具體操作,請參見部署alibaba-cloud-metrics-adapter組件。
說明您可以登錄容器服務管理控制臺,在頁面部署ack-alibaba-cloud-metrics-adapter組件。
功能介紹
默認HPA只支持基于CPU和內存的自動伸縮,并不能滿足日常的運維需求。阿里云Prometheus監控全面對接開源Prometheus生態,支持類型豐富的組件監控,提供多種開箱即用的預置監控大盤,且提供全面托管的Prometheus服務。此功能主要分為三個步驟:
在ACK集群中使用Prometheus監控透出監控指標。
依托alibaba-cloud-metrics-adapter組件,負責轉換Prometheus監控指標為HPA可消費的Kubernetes聚合指標。更多信息,請參見Autoscaling on multiple metrics and custom metrics。
配置并部署HPA,根據上一步的指標進行彈性擴縮。
指標類型根據場景分為兩種:
Custom Metric:根據與要進行擴縮的Kubernetes目標對象(例如Pod)相關的指標進行擴縮,例如Pod自身維度的指標。更多信息,請參見autoscaling-on-multiple-metrics-and-custom-metrics。
External Metric:根據與要進行擴縮的Kubernetes目標對象(例如Pod)不相關的指標進行擴縮。例如,通過整體的業務QPS指標來擴縮某一個Workload的Pod。更多信息,請參見autoscaling-on-metrics-not-related-to-kubernetes-objects。
下文介紹如何配置alibaba-cloud-metrics-adapter,實現將阿里云Prometheus指標轉換為HPA可用指標,并實現該指標自動伸縮。
步驟一:獲取Prometheus監控數據
示例一:使用ACK默認容器監控指標
您可以直接使用ACK默認安裝的阿里云Prometheus中的默認指標進行HPA彈性擴縮。支持的指標包括容器監控cAdvisor指標、節點基礎監控Node-Exporter、GPU-Exporter指標,以及您當前已接入到阿里云Prometheus中的所有指標。查看已接入阿里云Prometheus的指標的步驟如下:
登錄容器服務管理控制臺,在左側導航欄選擇集群。
在集群列表頁面,單擊目標集群名稱,然后在左側導航欄,選擇。
單擊右上角跳轉到Prometheus服務。
在Prometheus監控服務控制臺的左側導航欄,單擊設置,查看所有已接入阿里云Prometheus的指標。
示例二:通過Pod自身上報的Prometheus指標進行HPA擴縮
部署測試應用,并通過Prometheus標準方式暴露指標。更多信息,請參見metric_type。下文介紹如何部署sample-app應用,并自身透出http_requests_total的指標用來標識訪問次數。
部署應用的工作負載。
登錄容器服務管理控制臺,在左側導航欄選擇集群。
在集群列表頁面,單擊目標集群名稱,在左側導航欄,單擊。
在無狀態頁面右側,單擊使用YAML創建資源,然后在創建頁面,示例模板選擇自定義,配置以下YAML,單擊創建。
apiVersion: apps/v1 kind: Deployment metadata: name: sample-app labels: app: sample-app spec: replicas: 1 selector: matchLabels: app: sample-app template: metadata: labels: app: sample-app spec: containers: - image: luxas/autoscale-demo:v0.1.2 name: metrics-provider ports: - name: http containerPort: 8080 --- apiVersion: v1 kind: Service metadata: name: sample-app namespace: default labels: app: sample-app spec: ports: - port: 8080 name: http protocol: TCP targetPort: 8080 selector: app: sample-app type: ClusterIP說明此容器暴露出
http_requests_total的指標用來標識訪問次數。
添加ServiceMonitor。
登錄ARMS控制臺。
在左側導航欄選擇Prometheus監控 > 實例列表。
在頁面左上角選擇容器服務K8s集群所在的地域,然后單擊與集群同名的實例名稱。
在左側導航欄單擊服務發現,然后單擊配置頁簽。
在配置頁簽下單擊ServiceMonitor。
在ServiceMonitor頁簽下單擊添加ServiceMonitor創建ServiceMonitor,然后單擊確定。
apiVersion: monitoring.coreos.com/v1
kind: ServiceMonitor
metadata:
  name: sample-app
  namespace: default
spec:
  endpoints:
  - interval: 30s
    port: http
    path: /metrics
  namespaceSelector:
    any: true
  selector:
    matchLabels:
      app: sample-app
確認監控狀態。
在服務發現頁面,單擊Targets頁簽,如果看到default/sample-app/0(1/1 up),則說明您已成功在阿里云Prometheus監控到了部署的應用。
通過在Prometheus大盤中,查詢最近時間范圍的
http_requests_total數值,確定監控數據已經正確獲取。
步驟二:修改alibaba-cloud-metrics-adapter組件配置
登錄容器服務管理控制臺,在左側導航欄選擇集群。
在集群列表頁面,單擊目標集群名稱,在左側導航欄,單擊。
在Helm頁面的操作列,單擊ack-alibaba-cloud-metrics-adapter對應的更新。
在更新發布面板,配置如下YAML,然后單擊確定。
AlibabaCloudMetricsAdapter: ...... prometheus: enabled: true # 這里設置為true,打開整體Prometheus adapter功能。 # 填寫阿里云Prometheus監控的地址。 url: https://cn-beijing.arms.aliyuncs.com:9443/api/v1/prometheus/xxxx/xxxx/xxxx/cn-beijing # 阿里云Prometheus開啟鑒權Token后,請配置prometheusHeader Authorization。 prometheusHeader: - Authorization: xxxxxxx metricsRelistInterval: 1m # 重新獲取指標列表的時間周期,推薦保持默認1min。 logLevel: 5 # 組件調試日志級別,推薦保持默認。 adapter: rules: default: false # 默認指標獲取配置,推薦保持false。 custom: # 示例1:this is an example of custom metric config. # this config will convert prometheus metric: container_memory_working_set_bytes to a custom metric container_memory_working_set_bytes_per_second # and cpu metric container_cpu_usage_seconds_total convert to container_cpu_usage_core_per_second # you can run command to check the memory/cpu value: # kubectl get --raw "/apis/custom.metrics.k8s.io/v1beta1/namespaces/kube-system/pods/*/container_memory_working_set_bytes_per_second" # kubectl get --raw "/apis/custom.metrics.k8s.io/v1beta1/namespaces/kube-system/pods/*/container_cpu_usage_core_per_second" # refer to doc: http://m.bestwisewords.com/document_detail/184519.html - seriesQuery: 'container_memory_working_set_bytes{namespace!="",pod!=""}' resources: overrides: namespace: { resource: "namespace" } pod: { resource: "pod" } name: matches: "^(.*)_bytes" as: "${1}_bytes_per_second" metricsQuery: 'sum(<<.Series>>{<<.LabelMatchers>>}) by (<<.GroupBy>>)' # metricsQuery配置中的labelSelector不會繼承series_Query的過濾標簽。 - seriesQuery: 'container_cpu_usage_seconds_total{namespace!="",pod!=""}' resources: overrides: namespace: { resource: "namespace" } pod: { resource: "pod" } name: matches: "^(.*)_seconds_total" as: "${1}_core_per_second" metricsQuery: 'sum(rate(<<.Series>>{<<.LabelMatchers>>}[1m])) by (<<.GroupBy>>)' # metricsQuery配置中的labelSelector不會繼承series_Query的過濾標簽。 # 示例2:this is an example of external metric config. # refer to doc: http://m.bestwisewords.com/document_detail/608768.html # 添加新的轉換規則,請確保阿里云Prometheus中指標標簽和此處一致,如果不一致,請參見ARMS Prometheus中指標標簽修改。 #- seriesQuery: http_requests_total{namespace!="",pod!=""} # resources: # overrides: # # 此處resource為Kubernetes的API Resource,可通過kubectl api-resources -o wide查看。 # # 此處key對應Prometheus數據中的LabelName,請確認Prometheus指標數據中有此LabelName。 # namespace: {resource: "namespace"} # pod: {resource: "pod"} # name: # matches: ^(.*)_total # as: ${1}_per_second # metricsQuery: sum(rate(<<.Series>>{<<.LabelMatchers>>}[2m])) by (<<.GroupBy>>) # this is an example of external metric config. # refer to doc: http://m.bestwisewords.com/document_detail/608768.html #- seriesQuery: arms_app_requests_count # metricsQuery: sum by (rpc) (sum_over_time(<<.Series>>{rpc="/demo/queryUser/{id}",service="arms-demo:arms-k8s-demo",prpc="__all__",ppid="__all__",endpoint="__all__",destId="__all__",<<.LabelMatchers>>}[1m])) # name: # as: ${1}_per_second_queryuser # matches: ^(.*)_count # resources: # namespaced: false # this is an example of custom metric from user define prometheus metric: http_requests_total # refer to doc: http://m.bestwisewords.com/document_detail/184519.html #- seriesQuery: 'http_requests_total{namespace!="",pod!=""}' # resources: # overrides: # namespace: {resource: "namespace"} # pod: {resource: "pod"} # name: # matches: "^(.*)_total" # as: "${1}_per_second" # metricsQuery: 'sum(rate(<<.Series>>{<<.LabelMatchers>>}[2m])) by (<<.GroupBy>>)' # - seriesQuery: '{__name__=~"^some_metric_count$"}' # resources: # template: <<.Resource>> # name: # matches: "" # as: "my_custom_metric" # metricsQuery: sum(<<.Series>>{<<.LabelMatchers>>}) by (<<.GroupBy>>) ......部分字段說明如下。關于ack-alibaba-cloud-adapter配置文件的詳細說明,請參見ack-alibaba-cloud-adapter配置文件詳解。
字段
說明
AlibabaCloudMetricsAdapter. prometheus.adapter.rules.custom該字段內容請修改為示例YAML中對應的內容。
alibabaCloudMetricsAdapter. prometheus.url填寫阿里云Prometheus監控的地址。關于如何獲取Prometheus數據請求URL,請參見如何獲取Prometheus數據請求URL。
AlibabaCloudMetricsAdapter. prometheus.prometheusHeader[].Authorization填寫Token。關于如何獲取Token,請參見如何獲取Prometheus數據請求URL。
AlibabaCloudMetricsAdapter. prometheus.adapter.rules.default默認創建預置指標,推薦關閉,配置為
false。
配置Metrics-adapter組件參數,并成功部署Metrics-adapter組件后,可通過如下命令查看K8s聚合API是否已經成功接入數據。
通過Custom Metrics進行容器伸縮。
執行以下命令,通過Custom Metrics指標查詢方式,查看HPA可用指標的詳情和列表。
kubectl get --raw "/apis/custom.metrics.k8s.io/v1beta1/" | jq .執行以下命令,查詢
http_requests_per_second指標在default命名空間下的當前數值。# 通過查詢container_memory_working_set_bytes_per_second查看kube-system namespace中Pod的工作內存當前每秒大小。 kubectl get --raw "/apis/custom.metrics.k8s.io/v1beta1/namespaces/kube-system/pods/*/container_memory_working_set_bytes_per_second" # 通過查詢container_cpu_usage_core_per_second查看kube-system namespace中Pod的CPU使用核數每秒大小。 kubectl get --raw "/apis/custom.metrics.k8s.io/v1beta1/namespaces/kube-system/pods/*/container_cpu_usage_core_per_second"指標查詢結果示例:
{
  "kind": "MetricValueList",
  "apiVersion": "custom.metrics.k8s.io/v1beta1",
  "metadata": {
    "selfLink": "/apis/custom.metrics.k8s.io/v1beta1/namespaces/kube-system/pods/%2A/container_memory_working_set_bytes_per_second"
  },
  "items": [
    {
      "describedObject": {
        "kind": "Pod",
        "namespace": "kube-system",
        "name": "ack-alibaba-cloud-metrics-adapter-7cf8dcb845-h****",
        "apiVersion": "/v1"
      },
      "metricName": "container_memory_working_set_bytes_per_second",
      "timestamp": "2023-08-09T06:30:19Z",
      "value": "24576k",
      "selector": null
    }
  ]
}
通過External Metrics進行容器伸縮。
執行以下命令,通過External Metrics指標查詢方式,查看HPA可用的External指標詳情和列表。
kubectl get --raw "/apis/external.metrics.k8s.io/v1beta1/" | jq .執行以下命令,查詢
http_requests_per_second指標在default命名空間下的當前數值。kubectl get --raw "/apis/external.metrics.k8s.io/v1beta1/namespaces/default/http_requests_per_second"示例輸出:
{
  "kind": "ExternalMetricValueList",
  "apiVersion": "external.metrics.k8s.io/v1beta1",
  "metadata": {},
  "items": [
    {
      "metricName": "http_requests_per_second",
      "metricLabels": {},
      "timestamp": "2022-01-28T08:40:20Z",
      "value": "33m"
    }
  ]
}
步驟三:配置并部署HPA,根據獲得的指標進行彈性擴縮
部署HPA
當前版本已支持Prometheus Metrics同時透出Custom Metrics與External Metrics。您可以根據需求任選以下方式通過HPA進行容器伸縮。
類型 | 說明 |
Custom Metric | 根據與要進行擴縮的Kubernetes目標對象(例如Pod)相關的指標進行擴縮,例如Pod自身維度的指標。更多信息,請參見autoscaling-on-multiple-metrics-and-custom-metrics。 |
External Metric | 根據與要進行擴縮的Kubernetes目標對象(例如Pod)不相關的指標進行擴縮,例如通過整體的業務QPS指標來擴縮某一個Workload的Pod。更多信息,請參見autoscaling-on-metrics-not-related-to-kubernetes-objects。 |
通過Custom Metrics進行容器伸縮
使用以下內容,創建hpa.yaml文件。
kind: HorizontalPodAutoscaler
apiVersion: autoscaling/v2
metadata:
  name: sample-app-memory-high
spec:
# HPA的伸縮對象描述,HPA會動態修改該對象的Pod數量。
  scaleTargetRef:
    apiVersion: apps/v1
    kind: Deployment
    name: sample-app
# HPA的最小Pod數量和最大Pod數量。
  minReplicas: 1
  maxReplicas: 10
# 監控的指標數組,支持多種類型的指標共存。
  metrics:
  - type: Pods
    pods:
      # 使用指標:pods/container_memory_working_set_bytes_per_second。
      metric:
        name: container_memory_working_set_bytes_per_second
 # AverageValue類型的目標值,Pods指標類型下只支持AverageValue類型的目標值。
      target:
        type: AverageValue
        averageValue: 1024000m       # 此處1024000m代表1 KB內存閾值,當前指標單位為byte/per second,m為K8s轉換精度單位,當出現了小數點,K8s又需要高精度時,會使用單位m或k。例如1001m=1.001,1k=1000。
執行以下命令,創建HPA應用。
kubectl apply -f hpa.yaml執行以下命令,查看HPA是否生效。
kubectl get hpa sample-app-memory-high預期輸出:
NAME                     REFERENCE               TARGETS           MINPODS   MAXPODS   REPLICAS   AGE
sample-app-memory-high   Deployment/sample-app   24576k/1024000m   3         10        1          7m
通過External Metrics進行容器伸縮
使用以下內容,創建hpa.yaml文件。
apiVersion: autoscaling/v2
kind: HorizontalPodAutoscaler
metadata:
  name: sample-app
spec:
  scaleTargetRef:
    apiVersion: apps/v1
    kind: Deployment
    name: sample-app
  minReplicas: 1
  maxReplicas: 10
  metrics:
    - type: External
      external:
        metric:
          name: http_requests_per_second
          selector:
            matchLabels:
              job: "sample-app"
# External指標類型下只支持Value和AverageValue類型的目標值。
        target:
          type: AverageValue
          averageValue: 500m
執行以下命令,創建HPA應用。
kubectl apply -f hpa.yaml在Service中開啟負載均衡后,執行以下命令,進行壓測實驗。
ab -c 50 -n 2000 LoadBalancer(sample-app):8080/執行以下命令,查看HPA詳情。
kubectl get hpa sample-app預期輸出:
NAME         REFERENCE               TARGETS    MINPODS   MAXPODS   REPLICAS   AGE
sample-app   Deployment/sample-app   33m/500m   1         10        1          7m
ack-alibaba-cloud-adapter配置文件詳解
ack-alibaba-cloud-adapter通過以下步驟將Prometheus中的指標轉換成HPA可用的指標:
Discovery:ack-alibaba-cloud-adapter會從Prometheus發現可用的指標。
Association:將指標與Kubernetes資源(Pod、Node、Namespace)相關聯。
Naming:定義轉換后的HPA可用指標名稱。
Querying:定義查詢Prometheus語句。
以上文中sample-app容器中暴露出來的http_requests_total指標轉換成HPA中的http_requests_per_second為例,完整的ack-alibaba-cloud-adapter配置文件如下。
- seriesQuery: http_requests_total{namespace!="",pod!=""}
  resources:
    overrides:
      namespace: {resource: "namespace"}
      pod: {resource: "pod"}
  name:
    matches: ^(.*)_total
    as: ${1}_per_second
  metricsQuery: sum(rate(<<.Series>>{<<.LabelMatchers>>}[2m])) by (<<.GroupBy>>)
字段 | 說明 |
| PromQL請求數據。 |
| 對seriesQuery中PromQL請求的數據做聚合操作。 說明
|
| 是PromQL里的數據Label,與 |
| 指根據正則匹配把Prometheus指標名轉為比較可讀的指標名,此處將 |
Discovery
指定待轉換的Prometheus指標,您可以通過
seriesFilters精確過濾指標。seriesQuery可以根據標簽進行查找,示例代碼如下。seriesQuery: http_requests_total{namespace!="",pod!=""} seriesFilters: - isNot: "^container_.*_seconds_total"seriesFilters為非必填項,用于過濾指標:is:<regex>:匹配包含該正則表達式的指標。isNot:<regex>:匹配不包含該正則表達式的指標。
Association
設置Prometheus指標標簽與Kubernetes中的資源映射關系。
http_requests_total指標的標簽包括namespace!=""和pod!=""。- seriesQuery: http_requests_total{namespace!="",pod!=""} resources: overrides: namespace: {resource: "namespace"} pod: {resource: "pod"}Naming
用于將Prometheus指標名稱轉換成HPA的指標名稱,但不會改變Prometheus本身的指標名稱。如果使用Prometheus原來的指標,可以不設置。
您可以通過執行命令
kubectl get --raw "/apis/custom.metrics.k8s.io/v1beta1"查看HPA可用的所有指標。- seriesQuery: http_requests_total{namespace!="",pod!=""} resources: overrides: namespace: {resource: "namespace"} pod: {resource: "pod"} name: matches: "^(.*)_total" as: "${1}_per_second"Querying
查詢Prometheus API的模板。ack-alibaba-cloud-adapter會根據HPA中的參數,填充參數到此模板中,然后發送給Prometheus API請求,并將獲得的值最終提供給HPA進行彈性擴縮。
- seriesQuery: http_requests_total{namespace!="",pod!=""} resources: overrides: namespace: {resource: "namespace"} pod: {resource: "pod"} name: matches: ^(.*)_total as: ${1}_per_second metricsQuery: sum(rate(<<.Series>>{<<.LabelMatchers>>}[2m])) by (<<.GroupBy>>)
如何獲取Prometheus數據請求URL
場景一:阿里云Prometheus監控
登錄容器服務管理控制臺,在左側導航欄選擇集群。
在集群列表頁面,單擊目標集群名稱,然后在左側導航欄,選擇。
單擊右上角跳轉到Prometheus服務。
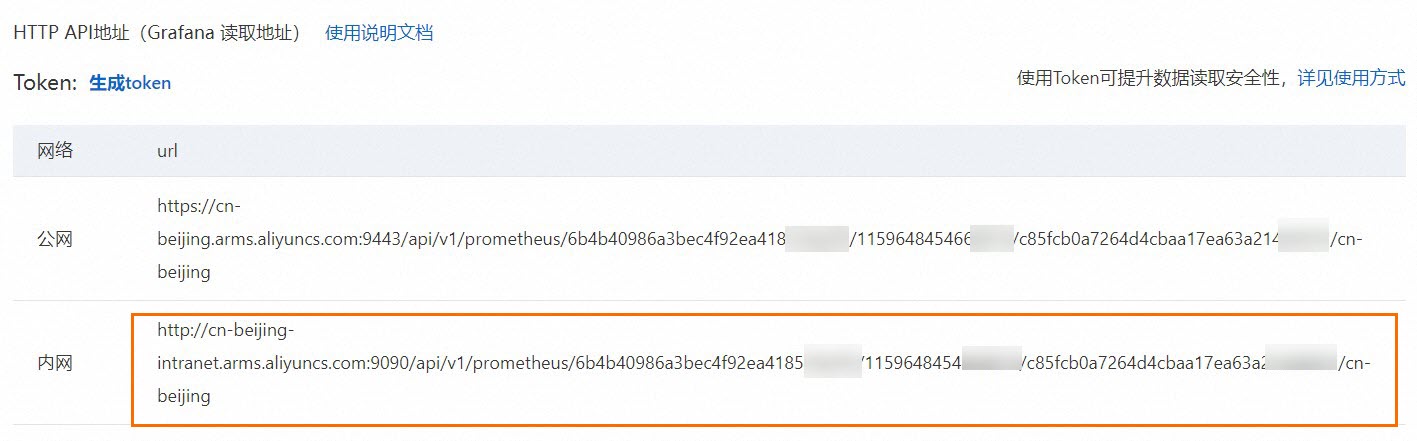
在Prometheus監控服務控制臺的左側導航欄,單擊設置,然后單擊設置頁簽,獲取HTTP API地址(Grafana 讀取地址)。
推薦使用內網,如無法使用內網時,可使用公網。
場景二:開源Prometheus監控
針對開源自建Prometheus方案,您需要通過Service暴露Prometheus的標準訪問API,然后將其配置在metrics-adapter組件的Prometheus數據源URL參數中,即可完成基于開源Prometheus數據的HPA數據源配置。
下文以ACK應用市場提供的ack-prometheus-operator社區版應用Helm Chart為例。更多信息,請參見開源Prometheus監控。
部署Prometheus監控方案,并暴露標準Prometheus API。
登錄容器服務管理控制臺,在左側導航欄選擇。
在應用市場頁面,搜索并單擊ack-prometheus-operator,然后在頁面右側,單擊一鍵部署。
在創建頁面,選擇集群和命名空間,按需修改發布名稱,然后單擊下一步,按需修改參數,然后單擊確定。
查看部署結果。
通過Service暴露Prometheus的標準API,當前以ack-prometheus-operator的Service:ack-prometheus-operator-prometheus為例。
在瀏覽器中訪問ServiceIP:9090,如需為Service開通公網訪問SLB,查看Prometheus控制臺。
在頁面上方菜單欄,單擊,查看所有采集任務。
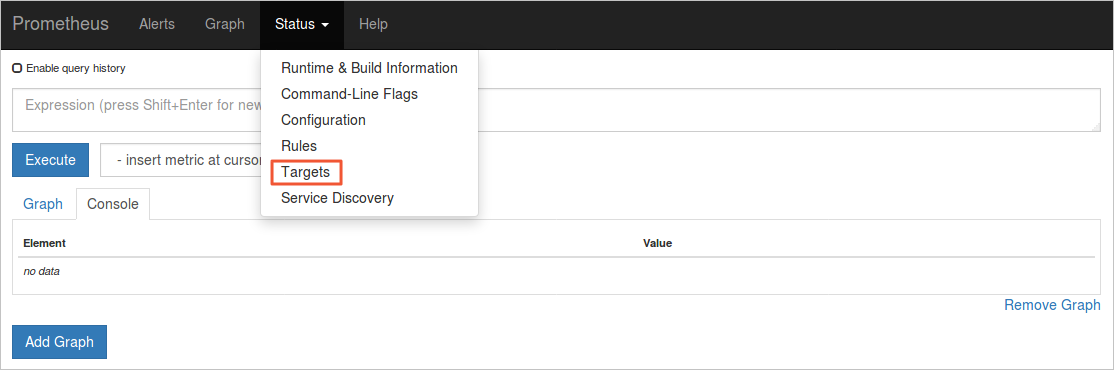
如果所有任務的狀態為UP,表示所有采集任務均已正常運行。
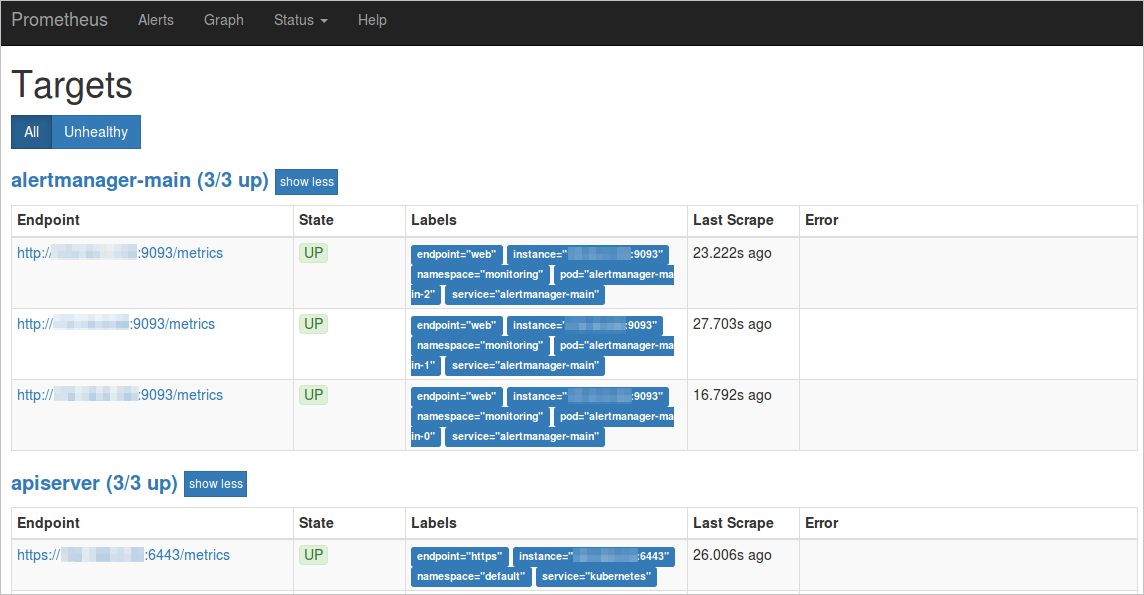
查看Labels中對應的service和namespace。
本示例以ServiceName為ack-prometheus-operator-prometheus,ServiceNamespace為monitoring為例說明該開源Prometheus數據請求的URL。
http://ack-prometheus-operator-prometheus.monitoring.svc.cluster.local:9090
配置組件的Prometheus數據源URL參數中,以確保組件與Prometheus之間的通信正常。
如果選擇通過公網訪問Prometheus的標準API,可參見以下示例進行配置。
  AlibabaCloudMetricsAdapter:
  ......
    prometheus:
      enabled: true
      url: http://your_domain.com:9090   # 請將your_domain.com替換為您的公網IP
以ack-prometheus-operator方案為例,此時
url值為http://ack-prometheus-operator-prometheus.monitoring.svc.cluster.local:9090。
相關文檔
如需通過外部指標(External Metrics),例如HTTP請求率、Ingress QPS等指標實現HPA,請參見基于阿里云組件指標的容器水平伸縮。
如需通過Nginx Ingress對多個應用進行HPA,以根據應用的負載情況動態調整Pod副本數量,請參見通過Nginx Ingress對多個應用進行HPA。