通過Zipkin為應用埋點并上報鏈路數據至可觀測鏈路 OpenTelemetry 版后,可觀測鏈路 OpenTelemetry 版即可開始監控應用,您可以查看應用拓撲、調用鏈路、異常事務、慢事務和SQL分析等一系列監控數據。本文介紹如何進行手動埋點,以及使用插件進行自動埋點。
為獲得更豐富的功能、更先進的鏈路追蹤能力,以及最佳使用體驗,建議您使用OpenTelemetry協議將應用接入可觀測鏈路 OpenTelemetry 版。
我們為您提供了詳細的OpenTelemetry接入指南和最佳實踐,幫助您快速上手可觀測鏈路 OpenTelemetry 版。更多信息,請參見接入應用。
前提條件
新版控制臺
登錄可觀測鏈路 OpenTelemetry 版控制臺,在左側導航欄單擊接入中心。
在開源框架區域單擊Zipkin卡片。
在彈出的Zipkin面板中選擇數據需要上報的地域。
說明初次接入的地域將會自動進行資源初始化。
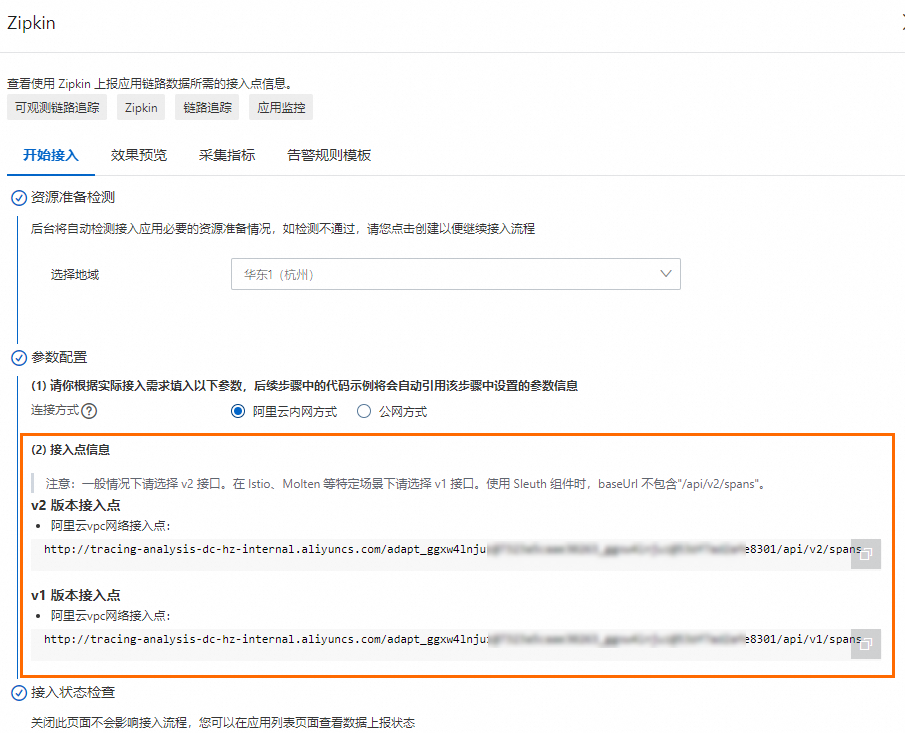
選擇連接方式,然后復制接入點信息。
若您的服務部署在阿里云上,且所屬地域與選擇的接入地域一致,推薦使用阿里云內網方式,否則選擇公網方式。
舊版控制臺
在左側導航欄單擊集群配置,然后在右側頁面單擊接入點信息頁簽。
在頁面頂部選擇需要接入的地域,然后在集群信息區域打開顯示Token開關。
在客戶端采集工具區域單擊Zipkin。
在相關信息列中,獲取接入點信息。
 說明
說明如果應用部署于阿里云生產環境,則選擇阿里云VPC網絡接入點,否則選擇公網接入點。
背景信息
Zipkin是一款開源的分布式實時數據追蹤系統(Distributed Tracking System),由Twitter公司開發和貢獻。其主要功能是聚合來自各個異構系統的實時監控數據。
Zipkin已經開發多年,對各種框架的支持比較齊全,例如以下框架,完整信息請參考Zipkin官方文檔。
Apache HttpClient
Dubbo
gRPC
JAX-RS 2.X
Jersey Server
JMS (Java Message Service)
Kafka
MySQL
Netty
OkHttp
Servlet
Spark
Spring Boot
Spring MVC
要通過Zipkin將Java應用數據上報至可觀測鏈路 OpenTelemetry 版控制臺,首先需要完成埋點工作。您可以手動埋點,也可以利用各種現有插件實現埋點的目的。

手動埋點
如果選擇手動埋點,您就需要自行編寫代碼。
如需獲取Demo,請單擊下載源碼,進入manualDemo目錄,并根據Readme運行程序。
添加依賴Jar包。
<dependency>
            <groupId>io.zipkin.brave</groupId>
            <artifactId>brave</artifactId>
            <version>5.4.2</version>
        </dependency>
        <dependency>
            <groupId>io.zipkin.reporter2</groupId>
            <artifactId>zipkin-sender-okhttp3</artifactId>
            <version>2.7.9</version>
        </dependency>
創建Tracer。
private static final String zipkinEndPoint = "<endpoint>";
  ...
  // 構建數據發送對象。
  OkHttpSender sender = OkHttpSender.newBuilder().endpoint(zipkinEndPoint).build();

  // 構建數據上報對象。
  Reporter<Span> reporter = AsyncReporter.builder(sender).build();

  tracing = Tracing.newBuilder().localServiceName(localServiceName).spanReporter(reporter).build();
構建Span和Child Span。
private void firstBiz() {
        // 創建rootspan。
        tracing.tracer().startScopedSpan("parentSpan");
        Span span =  tracing.tracer().currentSpan();
        span.tag("key", "firstBiz");
        secondBiz();
        span.finish();
    }

    private void secondBiz() {
        tracing.tracer().startScopedSpanWithParent("childSpan", tracing.tracer().currentSpan().context());
        Span childSpan =  tracing.tracer().currentSpan();
        childSpan.tag("key", "secondBiz");
        childSpan.finish();
        System.out.println("end tracing,id:" + childSpan.context().traceIdString());
    }
(可選)為了快速排查問題,您可以為某個記錄添加一些自定義標簽,例如記錄是否發生錯誤、請求的返回值等。
tracer.activeSpan().setTag("http.status_code", "500");在分布式系統中發送RPC請求時會帶上Tracing數據,包括TraceId、ParentSpanId、SpanId、Sampled等。您可以在HTTP請求中使用Extract/Inject方法在HTTP Request Headers上透傳數據。總體流程如下:
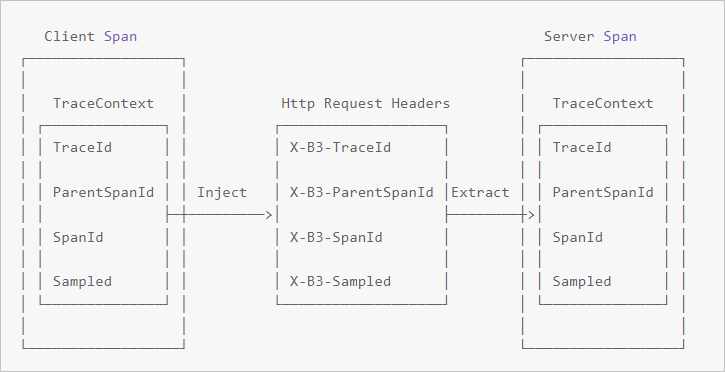
在客戶端調用Inject方法傳入Context信息。
// start a new span representing a client request
    oneWaySend = tracer.nextSpan().name(service + "/" + method).kind(CLIENT);
    --snip--

    // Add the trace context to the request, so it can be propagated in-band
    tracing.propagation().injector(Request::addHeader)
                     .inject(oneWaySend.context(), request);

   // fire off the request asynchronously, totally dropping any response
   request.execute();

   // start the client side and flush instead of finish
   oneWaySend.start().flush();
在服務端調用Extract方法解析Context信息。
// pull the context out of the incoming request
extractor = tracing.propagation().extractor(Request::getHeader);

// convert that context to a span which you can name and add tags to
oneWayReceive = nextSpan(tracer, extractor.extract(request))
    .name("process-request")
    .kind(SERVER)
    ... add tags etc.

// start the server side and flush instead of finish
oneWayReceive.start().flush();

// you should not modify this span anymore as it is complete. However,
// you can create children to represent follow-up work.
next = tracer.newSpan(oneWayReceive.context()).name("step2").start();
通過Spring 2.5 MVC或Spring 3.0 MVC插件埋點
您可以選擇通過Spring 2.5 MVC或Spring 3.0 MVC插件進行埋點。
如需獲取Demo,請單擊下載源碼,進入springMvcDemo\webmvc3|webmvc25目錄,并根據Readme運行程序。
在applicationContext.xml中配置Tracing對象。
<bean class="zipkin2.reporter.beans.OkHttpSenderFactoryBean">
  <property name="endpoint" value="<endpoint>"/>
</bean>

<!-- allows us to read the service name from spring config -->
<context:property-placeholder/>

<bean class="brave.spring.beans.TracingFactoryBean">
  <property name="localServiceName" value="brave-webmvc3-example"/>
  <property name="spanReporter">
    <bean class="zipkin2.reporter.beans.AsyncReporterFactoryBean">
      <property name="encoder" value="JSON_V2"/>
      <property name="sender" ref="sender"/>
      <!-- wait up to half a second for any in-flight spans on close -->
      <property name="closeTimeout" value="500"/>
    </bean>
  </property>
  <property name="propagationFactory">
    <bean class="brave.propagation.ExtraFieldPropagation" factory-method="newFactory">
      <constructor-arg index="0">
        <util:constant static-field="brave.propagation.B3Propagation.FACTORY"/>
      </constructor-arg>
      <constructor-arg index="1">
        <list>
          <value>user-name</value>
        </list>
      </constructor-arg>
    </bean>
  </property>
  <property name="currentTraceContext">
    <bean class="brave.spring.beans.CurrentTraceContextFactoryBean">
      <property name="scopeDecorators">
        <bean class="brave.context.log4j12.MDCScopeDecorator" factory-method="create"/>
      </property>
    </bean>
  </property>
</bean>

<bean class="brave.spring.beans.HttpTracingFactoryBean">
  <property name="tracing" ref="tracing"/>
</bean>
添加Interceptors對象。
<bean class="brave.httpclient.TracingHttpClientBuilder"
      factory-method="create">
    <constructor-arg type="brave.http.HttpTracing" ref="httpTracing"/>
  </bean>

  <bean factory-bean="httpClientBuilder" factory-method="build"/>

  <bean class="org.springframework.web.servlet.mvc.annotation.DefaultAnnotationHandlerMapping">
    <property name="interceptors">
      <list>
        <bean class="brave.spring.webmvc.SpanCustomizingHandlerInterceptor"/>
      </list>
    </property>
  </bean>

  <!-- Loads the controller -->
  <context:component-scan base-package="brave.webmvc"/>
添加Filter對象。
<!-- Add the delegate to the standard tracing filter and map it to all paths -->
<filter>
  <filter-name>tracingFilter</filter-name>
  <filter-class>brave.spring.webmvc.DelegatingTracingFilter</filter-class>
</filter>
<filter-mapping>
  <filter-name>tracingFilter</filter-name>
  <url-pattern>/*</url-pattern>
</filter-mapping>
通過Spring 4.0 MVC或Spring Boot插件埋點
您可以選擇通過Spring 4.0 MVC或Spring Boot插件進行埋點。
如需獲取Demo,請單擊下載源碼,進入springMvcDemo\webmvc4-boot|webmv4目錄,并根據Readme運行程序。
配置Tracing和Filter。
/** Configuration for how to send spans to Zipkin */
  @Bean Sender sender() {
    return OkHttpSender.create("<endpoint>");
  }

  /** Configuration for how to buffer spans into messages for Zipkin */
  @Bean AsyncReporter<Span> spanReporter() {
    return AsyncReporter.create(sender());
  }

  /** Controls aspects of tracing such as the name that shows up in the UI */
  @Bean Tracing tracing(@Value("${spring.application.name}") String serviceName) {
    return Tracing.newBuilder()
        .localServiceName(serviceName)
        .propagationFactory(ExtraFieldPropagation.newFactory(B3Propagation.FACTORY, "user-name"))
        .currentTraceContext(ThreadLocalCurrentTraceContext.newBuilder()
            .addScopeDecorator(MDCScopeDecorator.create()) // puts trace IDs into logs
            .build()
        )
        .spanReporter(spanReporter()).build();
  }

  /** decides how to name and tag spans. By default they are named the same as the http method. */
  @Bean HttpTracing httpTracing(Tracing tracing) {
    return HttpTracing.create(tracing);
  }

  /** Creates client spans for http requests */
  // We are using a BPP as the Frontend supplies a RestTemplate bean prior to this configuration
  @Bean BeanPostProcessor connectionFactoryDecorator(final BeanFactory beanFactory) {
    return new BeanPostProcessor() {
      @Override public Object postProcessBeforeInitialization(Object bean, String beanName) {
        return bean;
      }

      @Override public Object postProcessAfterInitialization(Object bean, String beanName) {
        if (!(bean instanceof RestTemplate)) return bean;

        RestTemplate restTemplate = (RestTemplate) bean;
        List<ClientHttpRequestInterceptor> interceptors =
            new ArrayList<>(restTemplate.getInterceptors());
        interceptors.add(0, getTracingInterceptor());
        restTemplate.setInterceptors(interceptors);
        return bean;
      }

      // Lazy lookup so that the BPP doesn't end up needing to proxy anything.
      ClientHttpRequestInterceptor getTracingInterceptor() {
        return TracingClientHttpRequestInterceptor.create(beanFactory.getBean(HttpTracing.class));
      }
    };
  }

  /** Creates server spans for http requests */
  @Bean Filter tracingFilter(HttpTracing httpTracing) {
    return TracingFilter.create(httpTracing);
  }

  @Autowired SpanCustomizingAsyncHandlerInterceptor webMvcTracingCustomizer;

  /** Decorates server spans with application-defined web tags */
  @Override public void addInterceptors(InterceptorRegistry registry) {
    registry.addInterceptor(webMvcTracingCustomizer);
  }
配置autoconfigure(spring.factories)。
org.springframework.boot.autoconfigure.EnableAutoConfiguration=\
brave.webmvc.TracingConfiguration
通過Dubbo插件埋點
您可以選擇通過Dubbo插件進行埋點。
如需獲取Demo,請單擊下載源碼,進入dubboDemo目錄,并根據Readme運行程序。
添加依賴Jar包。
<dependency>
            <groupId>io.zipkin.brave</groupId>
            <artifactId>brave-instrumentation-dubbo-rpc</artifactId>
            <version>5.4.2</version>
        </dependency>

        <dependency>
            <groupId>io.zipkin.brave</groupId>
            <artifactId>brave-spring-beans</artifactId>
            <version>5.4.2</version>
        </dependency>

        <dependency>
            <groupId>io.zipkin.brave</groupId>
            <artifactId>brave-context-slf4j</artifactId>
            <version>5.4.2</version>
        </dependency>
        <dependency>
            <groupId>io.zipkin.reporter2</groupId>
            <artifactId>zipkin-sender-okhttp3</artifactId>
            <version>2.7.9</version>
        </dependency>
        <dependency>
            <groupId>io.zipkin.brave</groupId>
            <artifactId>brave</artifactId>
            <version>5.4.2</version>
        </dependency>

        <dependency>
            <groupId>io.zipkin.reporter2</groupId>
            <artifactId>zipkin-sender-okhttp3</artifactId>
            <version>2.7.9</version>
        </dependency>
配置Tracing對象。
<bean class="zipkin2.reporter.beans.OkHttpSenderFactoryBean">
        <property name="endpoint" value="<endpoint>"/>
    </bean>

    <bean class="brave.spring.beans.TracingFactoryBean">
        <property name="localServiceName" value="double-provider"/>
        <property name="spanReporter">
            <bean class="zipkin2.reporter.beans.AsyncReporterFactoryBean">
                <property name="sender" ref="sender"/>
                <!-- wait up to half a second for any in-flight spans on close -->
                <property name="closeTimeout" value="500"/>
            </bean>
        </property>
        <property name="currentTraceContext">
            <bean class="brave.spring.beans.CurrentTraceContextFactoryBean">
                <property name="scopeDecorators">
                    <bean class="brave.context.slf4j.MDCScopeDecorator" factory-method="create"/>
                </property>
            </bean>
        </property>
    </bean>
添加Filter配置。
// 服務端配置。
<dubbo:provider filter="tracing" />
// 客戶端配置。
<dubbo:consumer filter="tracing" />
通過Spring Sleuth插件埋點
您可以選擇通過Spring Sleuth插件進行埋點。
如需獲取Demo,請單擊下載源碼,進入sleuthDemo目錄,并根據Readme運行程序。
添加依賴Jar包。
<dependency>
            <groupId>io.zipkin.brave</groupId>
            <artifactId>brave</artifactId>
            <version>5.4.2</version>
        </dependency>

        <dependency>
            <groupId>io.zipkin.reporter2</groupId>
            <artifactId>zipkin-sender-okhttp3</artifactId>
            <version>2.7.9</version>
        </dependency>
        <dependency>
            <groupId>org.springframework.boot</groupId>
            <artifactId>spring-boot-starter-web</artifactId>
            <version>2.0.1.RELEASE</version>
        </dependency>
        <dependency>
            <groupId>org.springframework.cloud</groupId>
            <artifactId>spring-cloud-sleuth-core</artifactId>
            <version>2.0.1.RELEASE</version>
        </dependency>
        <dependency>
            <groupId>org.springframework.cloud</groupId>
            <artifactId>spring-cloud-sleuth-zipkin</artifactId>
            <version>2.0.1.RELEASE</version>
        </dependency>
配置application.yml。
說明請將
<endpoint_short>替換成前提條件中獲取的接入點信息(“公網接入點:”后面到“api/v2/spans”之前的內容)。spring: application: # This ends up as the service name in zipkin name: sleuthDemo zipkin: # Uncomment to send to zipkin, replacing 192.168.99.100 with your zipkin IP address baseUrl: <endpoint_short> sleuth: sampler: probability: 1.0 sample: zipkin: # When enabled=false, traces log to the console. Comment to send to zipkin enabled: true發起HTTP請求,例如
http://localhost:3380/traced。說明更多請求路徑,請參見Demo中
com.alibaba.apm.SampleController下的方法。
常見問題
問:Demo程序執行成功,但是為什么有的網站上無數據?
答:請斷點調試zipkin2.reporter.okhttp3.HttpCall中的parseResponse方法,查看上報數據時返回值。如果報403錯誤,表示用戶名配置不正確,需要檢查Endpoint配置。